


📘 TOGAF Series Guide: Value Stream Mapping
Introduction – Visualizing Value Delivery to Drive Architectural Decisions
In the evolving landscape of TOGAF 10, Enterprise Architecture has shifted from a purely technical discipline to one deeply rooted in business value. At the heart of this transformation is Value Stream Mapping (VSM), a technique elevated in the TOGAF Series Guides to bridge the persistent gap between strategic intent and operational reality. For many organizations, architecture efforts still struggle to articulate their relevance to stakeholders because they focus on systems and processes rather than the end-to-end delivery of value. VSM addresses this challenge directly by providing a structured, visual method for understanding how value flows through an organization, where it stalls, and where architectural interventions can have the greatest impact.
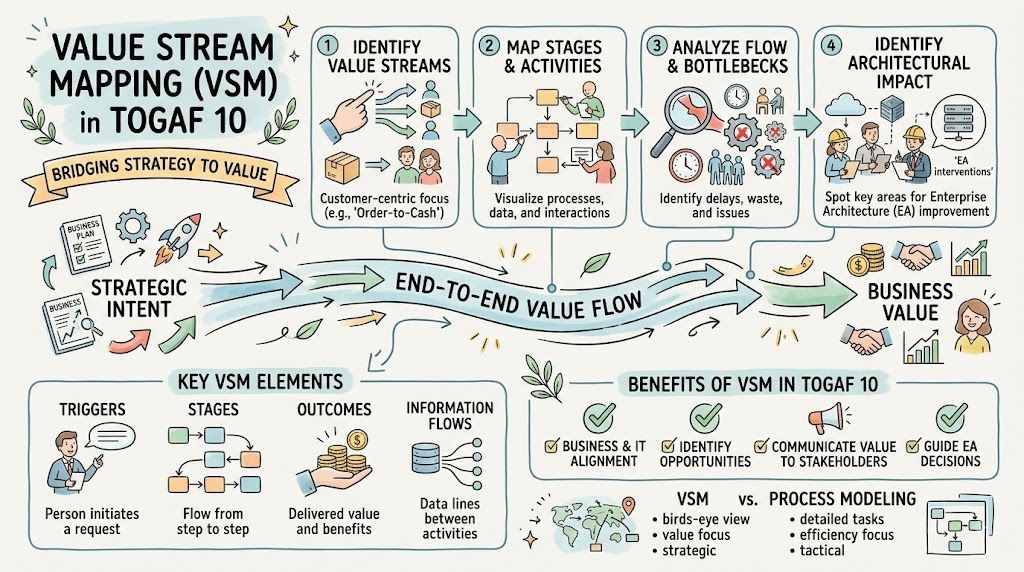
This article offers a beginner-friendly exploration of Value Stream Mapping as defined in the TOGAF framework, distinguishing it from traditional process modeling, walking through its core anatomy and methodology, and illustrating its practical application with real-world examples. Whether you are new to EA or seeking to align your architecture practice more closely with business outcomes, this guide provides the foundational knowledge needed to use VSM as a catalyst for meaningful, value-driven transformation.
1. What Is Value Stream Mapping in TOGAF?
In TOGAF 10, Value Stream Mapping is not just a process improvement tool—it is a core architecture technique that connects business strategy to IT capability.
A Value Stream represents an end-to-end collection of value-adding activities that create an overall result for a customer, stakeholder, or end user. VSM visualizes this flow to expose where value is created, where it stalls, and where architecture can enable improvement.
⚠️ Critical Distinction: Value Stream vs. Business Process
Beginners often confuse these. Understanding the difference is foundational to TOGAF 10.
| Dimension | Value Stream | Business Process |
|---|---|---|
| Focus | What value is delivered to the stakeholder | How work gets done internally |
| Perspective | Outside-in (customer/stakeholder view) | Inside-out (organizational/operational view) |
| Stability | Stable over time (value delivery rarely changes fundamentally) | Volatile (processes change with reorgs, tech, policy) |
| Granularity | High-level strategic stages | Detailed tasks, steps, decision points |
| EA Purpose | Align capabilities & technology to value creation | Automate, optimize, or redesign workflows |
| Example | “Acquire Insurance Customer” | “Validate applicant credit score via API call” |
💡 Key Insight: Value streams provide the stable scaffolding for architecture. Processes hang off that scaffolding and change frequently. Map value streams first, then decompose into processes.
2. Why VSM Matters for Enterprise Architects
The TOGAF Series Guide positions VSM as essential for four reasons:
-
Stakeholder Alignment: Speaks the language of business outcomes, not technical components. Executives understand value streams; they don’t understand microservices.
-
Capability-Based Planning: Each stage of a value stream maps directly to Business Capabilities, which in turn map to applications, data, and technology. This creates traceability from strategy to infrastructure.
-
Waste Identification: Exposes non-value-adding activities, delays, handoffs, and redundancies that represent architectural debt or transformation opportunities.
-
Investment Prioritization: Architecture investments are justified by their impact on specific value stream stages, enabling ROI-based portfolio decisions.
3. The Anatomy of a TOGAF Value Stream Map
A proper TOGAF VSM includes these standardized elements:
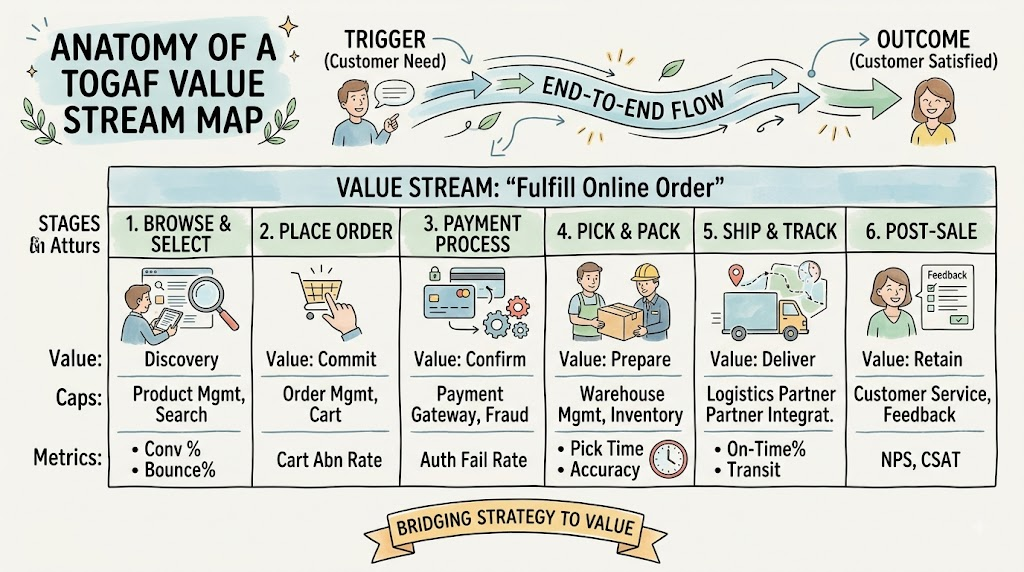
Required Elements Per Stage
| Element | Description | Beginner Tip |
|---|---|---|
| Stage Name | Verb-noun describing the value activity | Keep it stakeholder-centric: “Receive Payment” not “Process Transaction” |
| Value Delivered | What the stakeholder gains at this stage | Ask: “If we removed this stage, would the customer still get value?” |
| Business Capabilities | Abilities required to execute the stage | Map to your Capability Model; gaps here = architecture opportunities |
| Key Metrics | Quantitative measures of stage performance | Include both efficiency (cycle time) and effectiveness (quality/satisfaction) |
| Pain Points / Waste | Identified bottlenecks, delays, defects | Color-code: Red = critical, Yellow = moderate, Green = healthy |
| Enabling Technology | Applications, data, infrastructure supporting the stage | Link to Application & Technology Architecture inventories |
4. Step-by-Step VSM Technique for Beginners
Phase 1: Define Scope & Stakeholders
-
Identify the primary stakeholder whose value you’re mapping
-
Define clear trigger (what starts the stream) and outcome (what ends it)
-
Assemble a cross-functional team (business + IT + operations)
Phase 2: Map the Current State (“As-Is”)
-
Walk the actual value stream (Gemba walk); don’t map from memory
-
Document each stage with all required elements above
-
Capture actual metrics, not assumed ones
-
Identify pain points through direct observation and stakeholder interviews
Phase 3: Analyze Waste & Bottlenecks
Apply the TIM WOODS waste taxonomy adapted for EA:
| Waste Type | EA Manifestation | Architectural Opportunity |
|---|---|---|
| Transport | Unnecessary data movement between systems | API consolidation, event-driven integration |
| Inventory | Excess queued work items, backlog | Workflow automation, capacity scaling |
| Motion | Redundant approvals, excessive handoffs | Decision automation, self-service portals |
| Waiting | System latency, batch processing delays | Real-time processing, async architectures |
| Overproduction | Reports nobody reads, unused features | Capability rationalization, MVP approach |
| Overprocessing | Duplicate data entry, redundant validations | Master Data Management, single source of truth |
| Defects | Data errors, failed transactions | Validation frameworks, observability |
| Skills | Manual work automatable by technology | RPA, AI/ML augmentation |
Phase 4: Design Future State (“To-Be”)
-
Target identified waste with specific architectural interventions
-
Map new/enhanced capabilities to future-state stages
-
Define target metrics and improvement thresholds
-
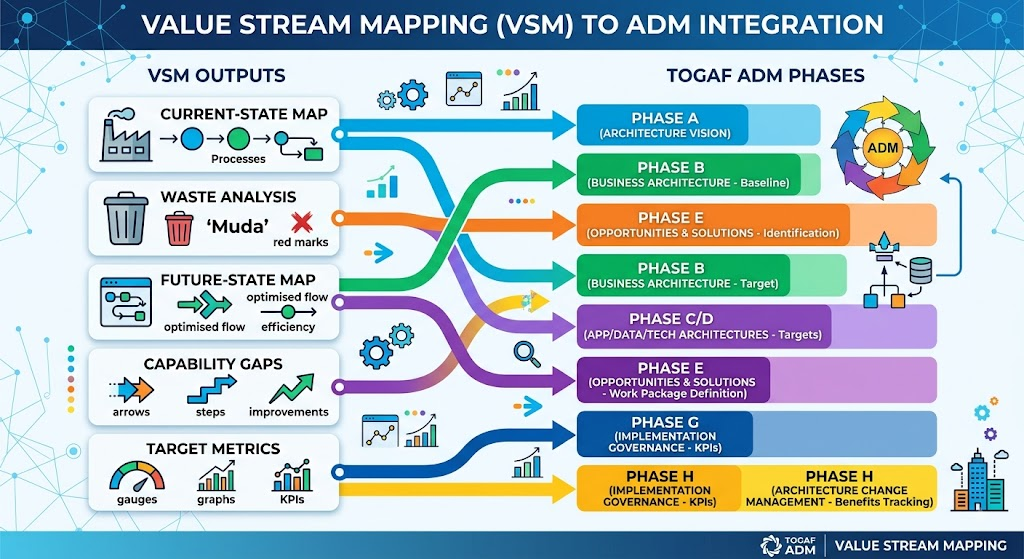
Validate with stakeholders before proceeding to ADM Phase E
Phase 5: Connect to ADM Phases
5. Practical Examples for Beginners
Example 1: Healthcare – “Treat Emergency Patient”
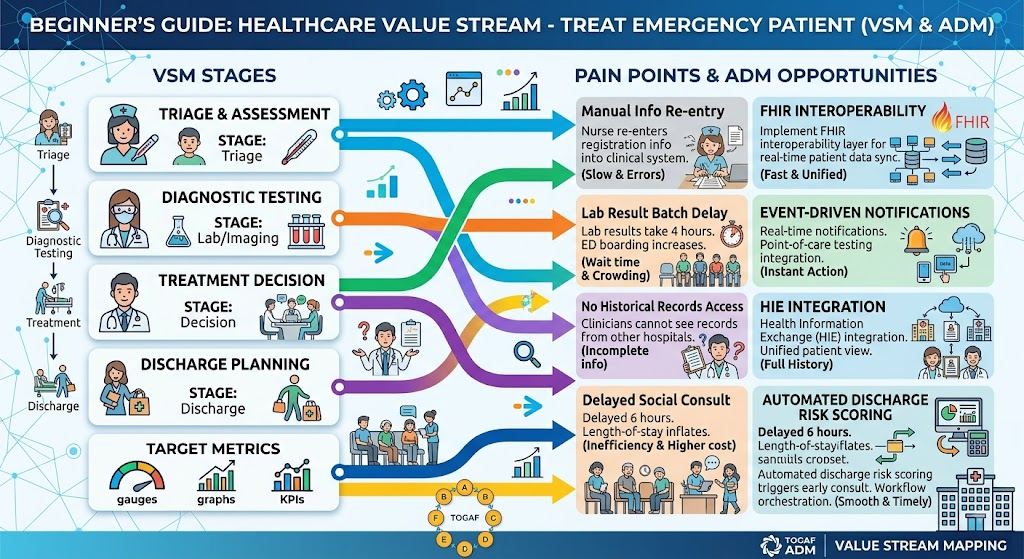
| Stage | Pain Point | Architectural Opportunity |
|---|---|---|
| Triage & Assessment | Nurses manually re-enter patient info from registration into clinical system | Implement FHIR-based interoperability layer; real-time patient data sync |
| Diagnostic Testing | Lab results take 4hrs due to batch processing; ED boarding increases | Event-driven lab result notification; point-of-care testing integration |
| Treatment Decision | Clinicians can’t access historical records from other facilities | Health Information Exchange (HIE) integration; unified patient view |
| Discharge Planning | Social work consult delayed 6hrs; length-of-stay inflates | Automated discharge risk scoring triggers early consult; workflow orchestration |
Example 2: Financial Services – “Onboard New Commercial Client”
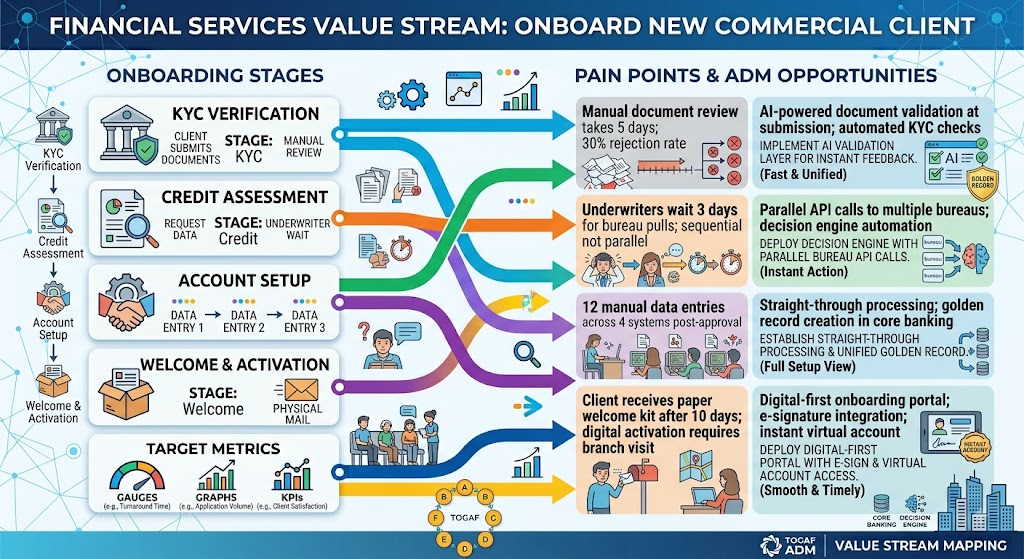
| Stage | Pain Point | Architectural Opportunity |
|---|---|---|
| KYC Verification | Manual document review takes 5 days; 30% rejection rate due to incomplete submissions | AI-powered document validation at submission; automated KYC checks |
| Credit Assessment | Underwriters wait 3 days for bureau pulls; sequential not parallel | Parallel API calls to multiple bureaus; decision engine automation |
| Account Setup | 12 manual data entries across 4 systems post-approval | Straight-through processing; golden record creation in core banking |
| Welcome & Activation | Client receives paper welcome kit after 10 days; digital activation requires branch visit | Digital-first onboarding portal; e-signature integration; instant virtual account |
6. Common Beginner Pitfalls & How to Avoid Them
| ❌ Pitfall | ✅ Best Practice |
|---|---|
| Mapping internal processes instead of stakeholder value | Always start with: “What does the stakeholder receive?” |
| Mapping alone at your desk | Co-create with people who actually do the work |
| Skipping current-state; jumping to future-state | You can’t fix what you haven’t honestly documented |
| Treating VSM as a one-time exercise | Re-map quarterly; value streams evolve |
| Ignoring metrics; making qualitative-only maps | Every stage needs at least one quantitative measure |
| Confusing value stream stages with org units | Stages cut across departments; don’t let org charts dictate structure |
| Not connecting to capabilities | A VSM without capability mapping is just a process diagram |