In the dynamic landscape of enterprise architecture and strategic planning, effective communication and alignment among stakeholders are paramount. The Value Chain Diagram, as a fundamental artifact in TOGAF ADM’s Vision phase, plays a pivotal role in achieving these objectives. This discussion explores the significance and purpose of the Value Chain Diagram within the context of TOGAF ADM. We will delve into its role in quickly aligning stakeholders, providing high-level orientation, and facilitating strategic decision-making. Through this exploration, we will gain a comprehensive understanding of how this diagram serves as a critical catalyst for successful architectural engagements.
What is a Value Chain Diagram?
A Value Chain Diagram is a visual representation of an organization’s activities and processes that add value to its products or services. It was first introduced by Michael Porter in his book “Competitive Advantage: Creating and Sustaining Superior Performance.” The primary goal of this tool is to help businesses identify the various stages of their operations and analyze how each stage contributes to the overall value delivered to customers.
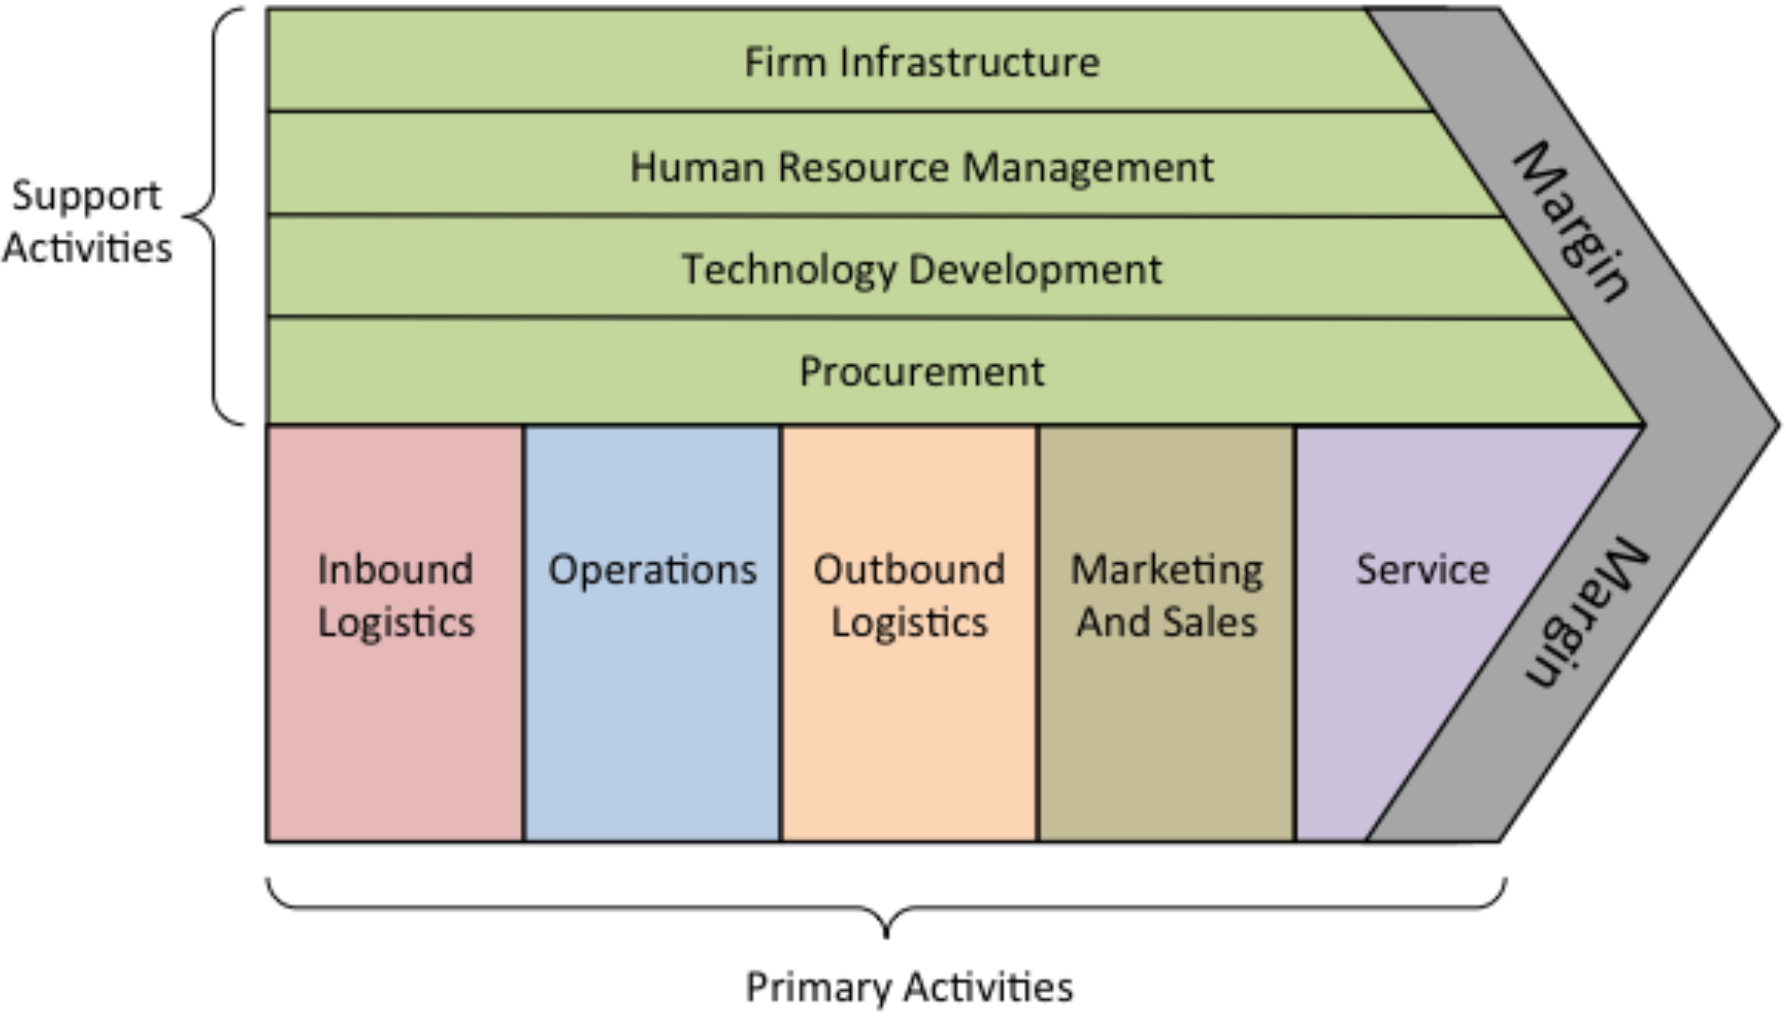
A typical Value Chain Diagram consists of two main components: primary activities and support activities.
- Primary Activities: These activities are directly involved in the production, marketing, delivery, and after-sales service of a product or service. The primary activities are divided into five categories:
- Inbound Logistics: This involves the receipt, storage, and distribution of raw materials and components required for production.
- Operations: The actual manufacturing or service delivery processes take place here.
- Outbound Logistics: After production, products need to be distributed to customers efficiently.
- Marketing and Sales: This includes all efforts to promote and sell the product or service.
- Service: Providing post-sales support, warranty, maintenance, and customer service falls under this category.
- Support Activities: These activities indirectly support the primary activities and help optimize the value chain. There are four primary support activities:
- Infrastructure: Management, finance, planning, and other administrative activities necessary for the organization’s operation.
- Human Resources: Recruiting, training, and development of employees.
- Technology Development: Research and development, technology acquisition, and innovation.
- Procurement: The process of sourcing and purchasing inputs like materials, equipment, and supplies.
Examples of Value Chain Diagrams
To better understand how Value Chain Diagrams work, let’s consider a few examples from different industries:
- Manufacturing Industry: A car manufacturer may use a Value Chain Diagram to analyze its operations. Inbound logistics would involve the procurement of materials like steel and plastic. Operations would encompass the assembly of the cars. Outbound logistics would deal with distributing the finished cars to dealerships. Marketing and sales would involve advertising and selling the cars, and service would provide customer support and maintenance.
- Retail Industry: A retail company might create a Value Chain Diagram to examine its activities. Inbound logistics would involve receiving products from suppliers. Operations would include stocking shelves and providing a pleasant shopping experience. Outbound logistics would focus on delivering products to customers or handling returns. Marketing and sales would encompass advertising and customer acquisition, while service would address customer inquiries and complaints.
- Technology Industry: A software development company could use a Value Chain Diagram. Inbound logistics would involve obtaining necessary hardware and software tools. Operations would entail writing code and creating software. Outbound logistics would involve delivering the software to customers or offering downloads. Marketing and sales would focus on advertising and licensing, and service would provide technical support and updates.
Benefits of Value Chain Diagrams
Value Chain Diagrams offer several advantages to businesses:
- Cost Reduction: Identifying inefficient processes or redundant activities can lead to cost savings.
- Competitive Advantage: By understanding the value chain, businesses can differentiate themselves in the market.
- Improved Decision-Making: Data-driven insights from the diagram can inform strategic decisions.
- Enhanced Customer Value: By optimizing activities, businesses can provide better value to customers.
- Supply Chain Optimization: It helps in streamlining supply chain processes, reducing lead times, and improving inventory management.
The Value Chain Diagram is a valuable tool for organizations across various industries. It provides a holistic view of a company’s operations and helps in identifying opportunities for improvement and cost reduction, ultimately leading to enhanced competitiveness and profitability. Businesses that harness the power of the Value Chain Diagram are better equipped to adapt to changing market conditions and deliver superior value to their customers.
Example Value Chain Analysis: Manufacturing Industry
Problem Scenario in the Manufacturing Industry:
Imagine a mid-sized automotive manufacturing company called “AutoTech Inc.” facing several challenges that are impacting its overall efficiency and profitability. The company has been experiencing declining sales and rising costs, leading to a significant reduction in its competitive edge within the automotive market. To address these issues, AutoTech Inc. decides to create a Value Chain Diagram to pinpoint areas in its operations that require optimization and cost reduction.
Value Chain Diagram for AutoTech Inc. (Manufacturing Industry)
Primary Activities:
- Inbound Logistics:
- Procurement of raw materials such as steel, aluminum, and plastics.
- Timely delivery of materials from suppliers.
- Inventory management to reduce holding costs.
- Operations:
- Vehicle assembly process.
- Quality control and inspection.
- Maintenance of manufacturing equipment.
- Outbound Logistics:
- Distribution of finished vehicles to dealerships and export markets.
- Management of transportation and delivery routes.
- Marketing and Sales:
- Advertising and promotion of new vehicle models.
- Dealer network management.
- Customer acquisition and sales.
- Service:
- Warranty and after-sales service.
- Maintenance and repair services.
- Customer support and parts availability.
Support Activities:
- Infrastructure:
- Centralized management and decision-making.
- Financial planning and budgeting.
- IT systems for data analysis and process monitoring.
- Human Resources:
- Recruitment, training, and development of skilled employees.
- Workforce scheduling and labor relations.
- Technology Development:
- Research and development of fuel-efficient engines.
- Innovation in vehicle design and features.
- Integration of automation and robotics in manufacturing.
- Procurement:
- Supplier relationship management.
- Negotiating favorable contracts.
- Cost-effective sourcing of materials and components.
Issues Identified in AutoTech Inc.’s Value Chain Diagram:
- Inbound Logistics: AutoTech Inc. faces delays in material deliveries due to unreliable suppliers. This results in production bottlenecks and increased holding costs for excess inventory.
- Operations: The assembly process is hindered by frequent breakdowns of manufacturing equipment, leading to production delays and increased maintenance costs.
- Outbound Logistics: The distribution process is inefficient, with suboptimal route planning leading to high transportation costs and delays in delivering vehicles to dealerships.
- Marketing and Sales: AutoTech Inc. has not effectively leveraged digital marketing and customer relationship management tools, resulting in subpar customer acquisition and reduced sales.
- Service: Customer complaints regarding warranty claim processing and limited availability of spare parts are affecting customer satisfaction and loyalty.
- Infrastructure: Lack of centralized data analytics tools and decision support systems hampers efficient decision-making across the organization.
- Human Resources: Employee turnover rates are high due to inadequate training and development programs, impacting the quality of work and workforce stability.
- Technology Development: The company has fallen behind in adopting advanced manufacturing technologies, impacting its ability to produce innovative and fuel-efficient vehicles.
- Procurement: AutoTech Inc. has not effectively negotiated with suppliers, resulting in unfavorable contract terms and higher procurement costs.
By identifying these issues within their Value Chain Diagram, AutoTech Inc. can now focus on addressing these challenges strategically. By improving these areas, the company aims to enhance its overall competitiveness, reduce costs, and provide better value to its customers in the automotive market.
Implementation Plan of the Findings
The following action plan outlines specific steps, responsible departments, and estimated timelines for addressing the identified issues in AutoTech Inc.’s Value Chain Diagram. It is essential for the company to follow through with these actions systematically to improve its operational efficiency, reduce costs, and enhance its competitiveness in the automotive market.
Here’s an action plan in table format to address the issues identified in AutoTech Inc.’s Value Chain Diagram:
| Issue | Action Steps | Responsible Department | Timeline |
|---|---|---|---|
| Inbound Logistics | 1. Evaluate existing suppliers for reliability and consider diversifying sources. | Procurement | 2-3 months |
| 2. Implement a Just-In-Time (JIT) inventory system to reduce holding costs. | Operations | 4-6 months | |
| Operations | 1. Conduct a comprehensive maintenance audit and invest in necessary equipment upgrades. | Operations | 6-9 months |
| 2. Implement preventive maintenance schedules to reduce breakdowns. | Operations | Ongoing | |
| Outbound Logistics | 1. Optimize distribution routes using route planning software. | Logistics | 3-4 months |
| 2. Explore partnerships with third-party logistics providers for efficiency. | Logistics | 6-9 months | |
| Marketing and Sales | 1. Develop a digital marketing strategy to target a wider audience. | Marketing | 4-6 months |
| 2. Invest in Customer Relationship Management (CRM) software for better customer insights. | Sales | 6-9 months | |
| Service | 1. Revise warranty claim processing procedures for quicker resolution. | Service | 3-4 months |
| 2. Increase spare parts inventory to ensure availability for customers. | Service | 6-9 months | |
| Infrastructure | 1. Implement a centralized data analytics platform for informed decision-making. | IT/Management | 6-12 months |
| 2. Hire a Chief Data Officer (CDO) to oversee data strategy and governance. | Management | 3-6 months | |
| Human Resources | 1. Enhance employee training programs to improve skills and reduce turnover. | HR | Ongoing |
| 2. Implement workforce planning to ensure adequate staffing levels. | HR | 6-9 months | |
| Technology Development | 1. Allocate R&D resources for developing fuel-efficient engine technologies. | R&D | Ongoing |
| 2. Invest in automation and robotics for more efficient manufacturing processes. | Operations/R&D | 6-12 months | |
| Procurement | 1. Renegotiate contracts with suppliers to secure more favorable terms. | Procurement | 4-6 months |
| 2. Develop a supplier performance monitoring system. | Procurement | 3-6 months |
The Role of Value Chain Diagram in TOGAF ADM
In the context of TOGAF (The Open Group Architecture Framework), the Value Chain Diagram serves as an artifact in the Vision phase (Phase A). Its purpose is to provide a high-level orientation view of an enterprise and how it interacts with the outside world. Let’s delve into how the Value Chain Diagram relates to TOGAF ADM (Architecture Development Method) and its specific purpose within this framework:
- Alignment and On-boarding: The primary purpose of the Value Chain Diagram, as defined in TOGAF, is to quickly onboard and align stakeholders for a particular change initiative. During the Vision phase, it is essential to ensure that all participants understand the high-level functional and organizational context of the architecture engagement. This diagram helps in achieving this alignment by offering a clear and easily understandable visual representation of the enterprise’s value chain.
- Presentational Impact: Unlike the more formal Functional Decomposition diagram, which is developed within Phase B (Business Architecture) and focuses on a detailed breakdown of business functions, the Value Chain Diagram emphasizes presentational impact. It provides a simplified yet comprehensive overview of how an organization delivers value to its customers and interacts with the external environment. This makes it particularly valuable when communicating with stakeholders who may not be familiar with the intricacies of the business architecture.
- High-Level Functional Context: The Value Chain Diagram showcases the sequence of activities and processes within the organization that contribute to the creation and delivery of value. This high-level functional context is vital in Phase A because it helps stakeholders grasp the big picture before diving into more detailed architecture development in subsequent phases.
- Supporting Change Initiatives: The diagram plays a crucial role in supporting change initiatives. By presenting an enterprise’s value chain, it helps stakeholders identify areas where architectural changes are needed to achieve strategic goals. This early alignment ensures that subsequent architecture work aligns with the organization’s objectives.
- Communication Tool: In TOGAF, effective communication with stakeholders is a key success factor. The Value Chain Diagram serves as a visual aid that simplifies complex concepts and facilitates discussions about how the enterprise functions and delivers value. It enhances the ability of architects to engage with stakeholders, gather input, and make informed decisions.
The Value Chain Diagram is an important artifact within TOGAF ADM’s Vision phase because it sets the stage for the architecture development process. Its purpose is to provide a high-level, easy-to-understand view of the enterprise’s functional and organizational context, helping stakeholders quickly grasp the essence of the architecture engagement and aligning them for subsequent phases of architecture development. It serves as a powerful communication tool and supports the identification of areas for architectural change in pursuit of the organization’s strategic objectives.
Summary
In this discussion, we have unraveled the pivotal role of the Value Chain Diagram within TOGAF ADM’s Vision phase. This diagram, as an artifact, serves as a bridge between complex enterprise architectures and stakeholder comprehension. Its purpose is clear: to swiftly onboard stakeholders and align them with the architectural initiative. Unlike more detailed diagrams developed in later phases, the Value Chain Diagram focuses on presentational impact, offering a simplified yet comprehensive view of an organization’s value delivery processes.
By providing a high-level functional context and emphasizing the organization’s interactions with the external world, this diagram ensures that all participants understand the architecture engagement’s context and goals. It supports change initiatives by identifying areas requiring architectural adjustments to meet strategic objectives. Moreover, the Value Chain Diagram serves as a powerful communication tool, fostering productive discussions and decision-making processes among stakeholders.
In the ever-evolving landscape of enterprise architecture, where clear alignment and effective communication are essential, the Value Chain Diagram stands as a vital instrument within TOGAF ADM, guiding organizations towards successful architectural transformations.